Mohr's Circle Stress & Strain Solvers
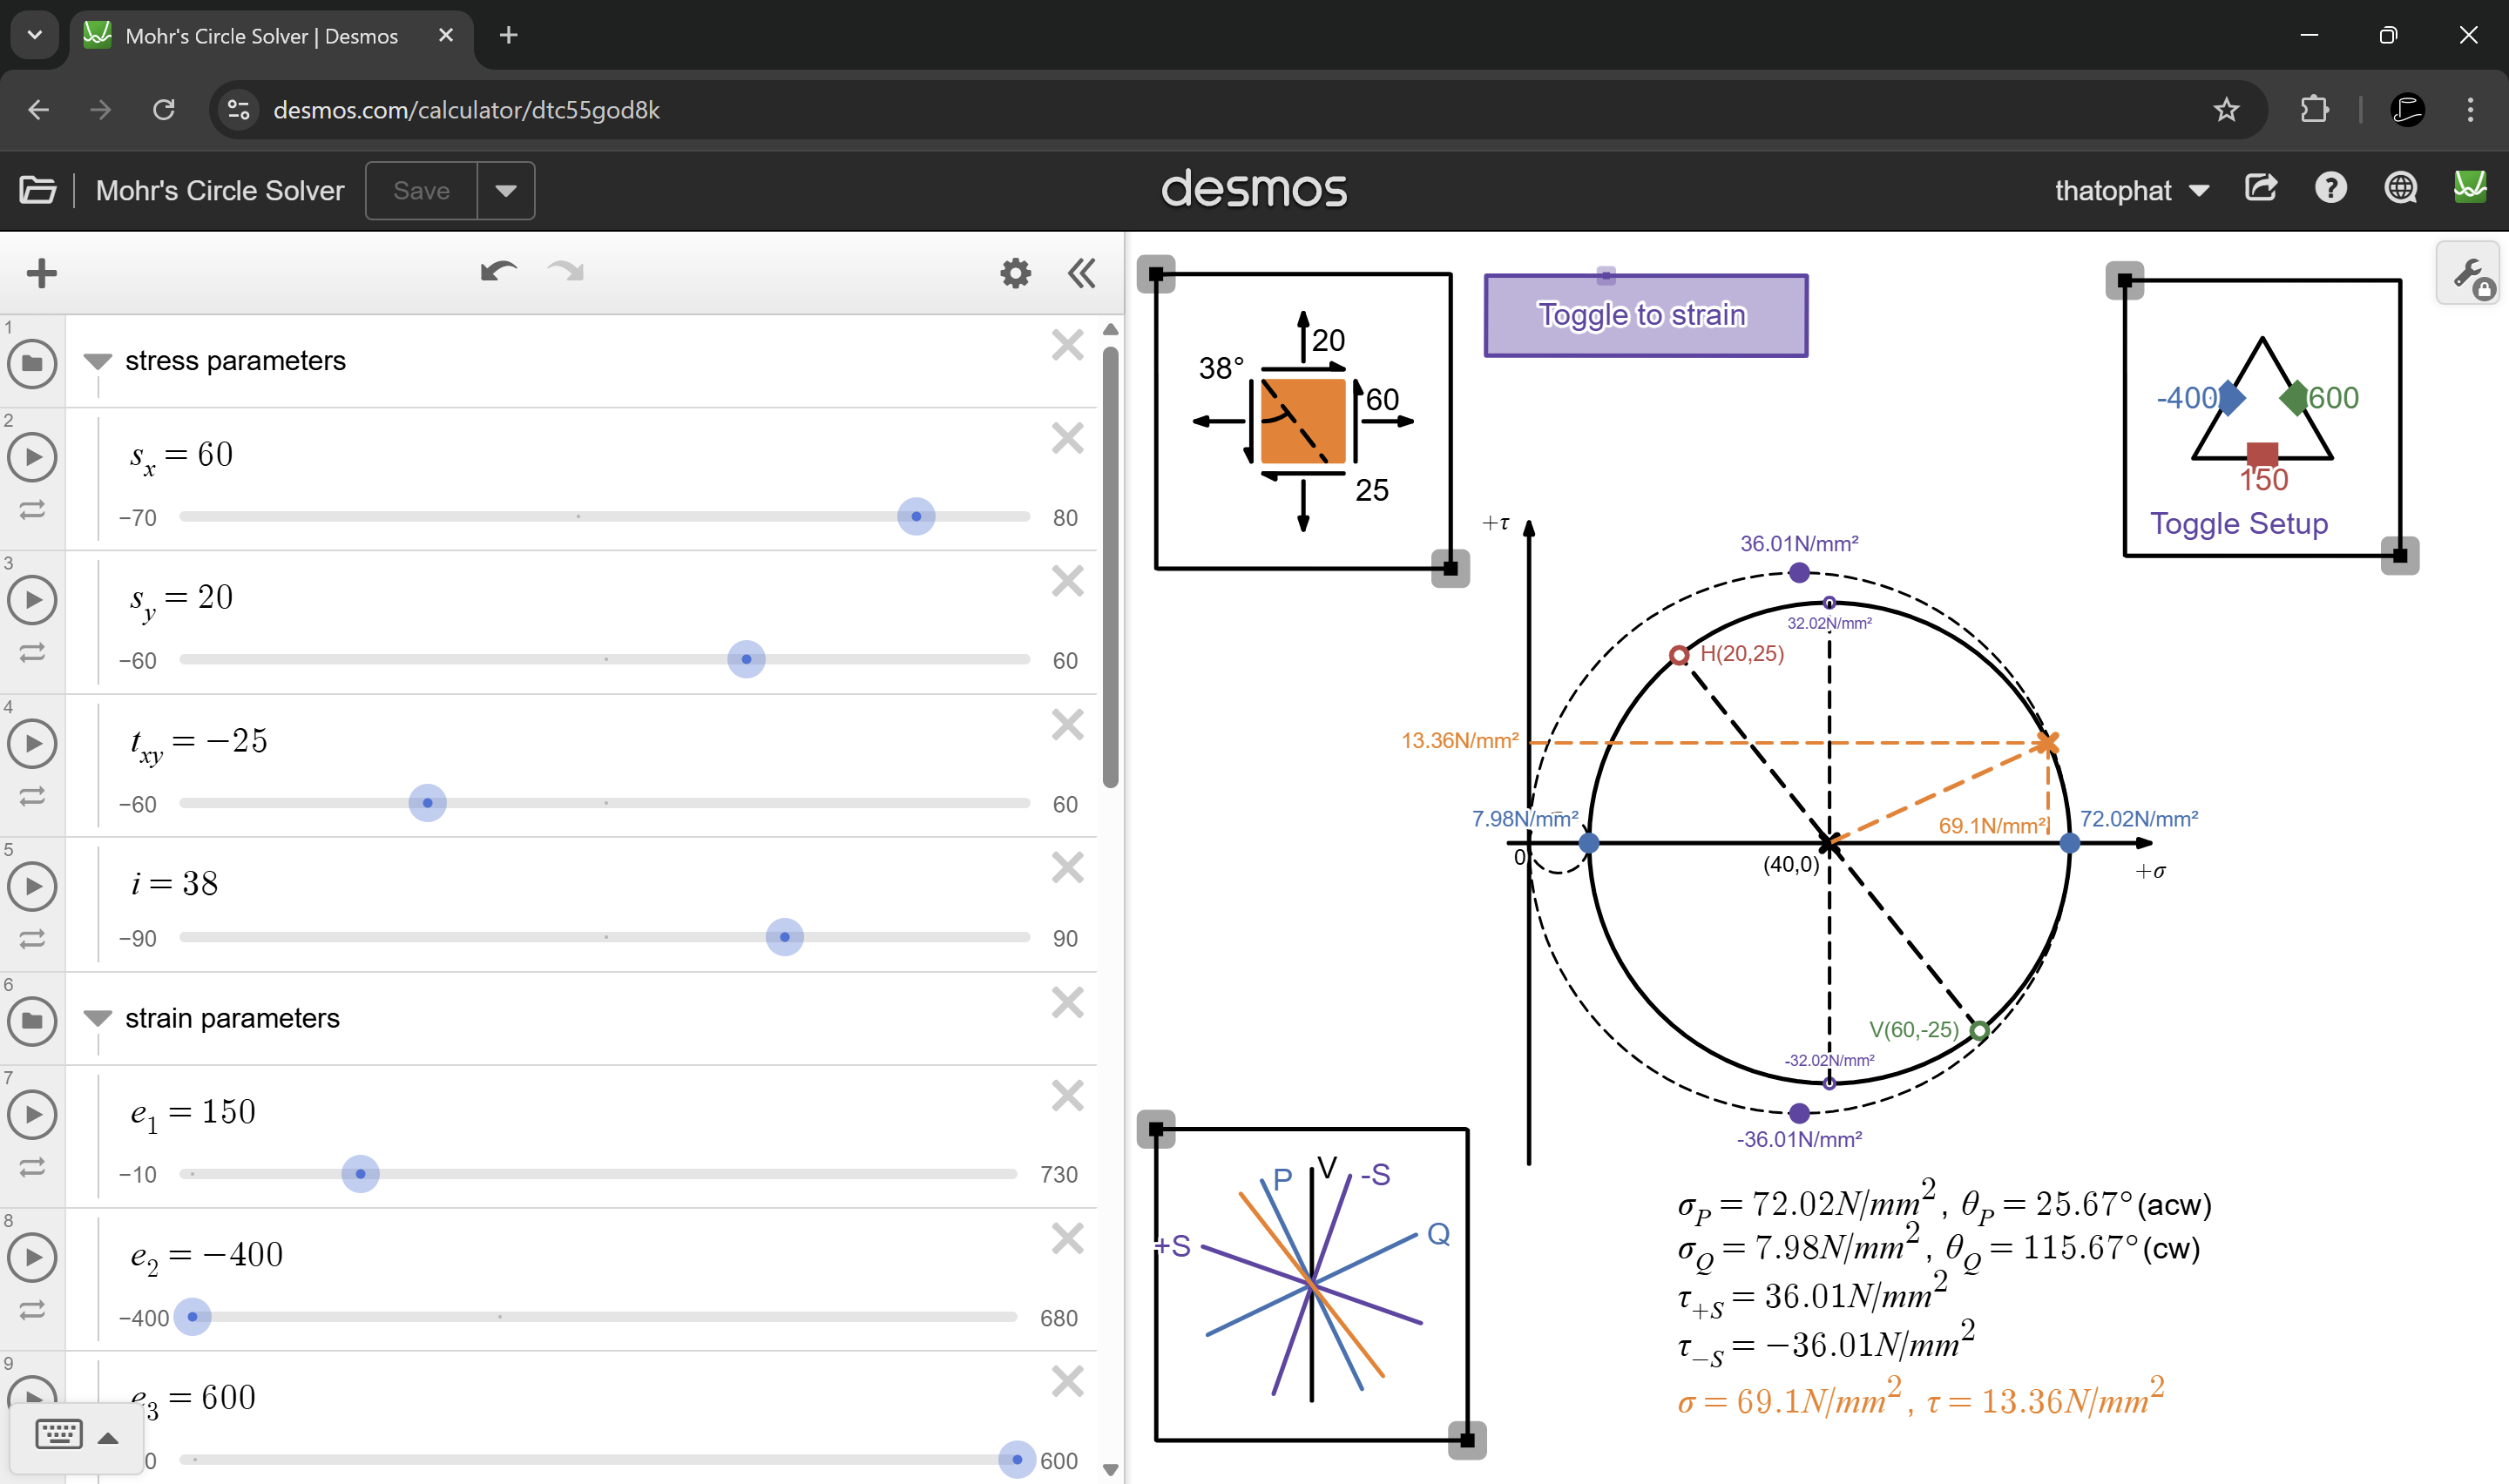
I made a solver that draws the Mohr's Circle for a given plane stress state, or for a given
strain gauge
rosette state, and finds the principle values.
The Mohr's Stress Circle works by finding the center and radius of the actual circle, and
finding the angle of the points on the fixed
R6 circle in the center, so that the circle always fits in the view regardless of the actual
range of stresses. The principle values and
joint values are also determined by the angles. When the stress in the z-direction is a
principle stress, circles representing the
other planes are rendered to show values like maximum shear stress.
The Mohr's Strain Circle works by taking in the strain gauge rosette setup, and the three
values, to draw where their points are on the R6
circle. Instead of using McClintock's Method, the circle uses formulas for the shear strain of
one of the points, to determine the other coordinates
and the center of the circle. The construction lines for McClintock's Method are also shown, as
well as the principle strains.
The solver can be found at this link.
Square-1 Puzzle Renderer
Beam Shear Force & Bending Moment Solver
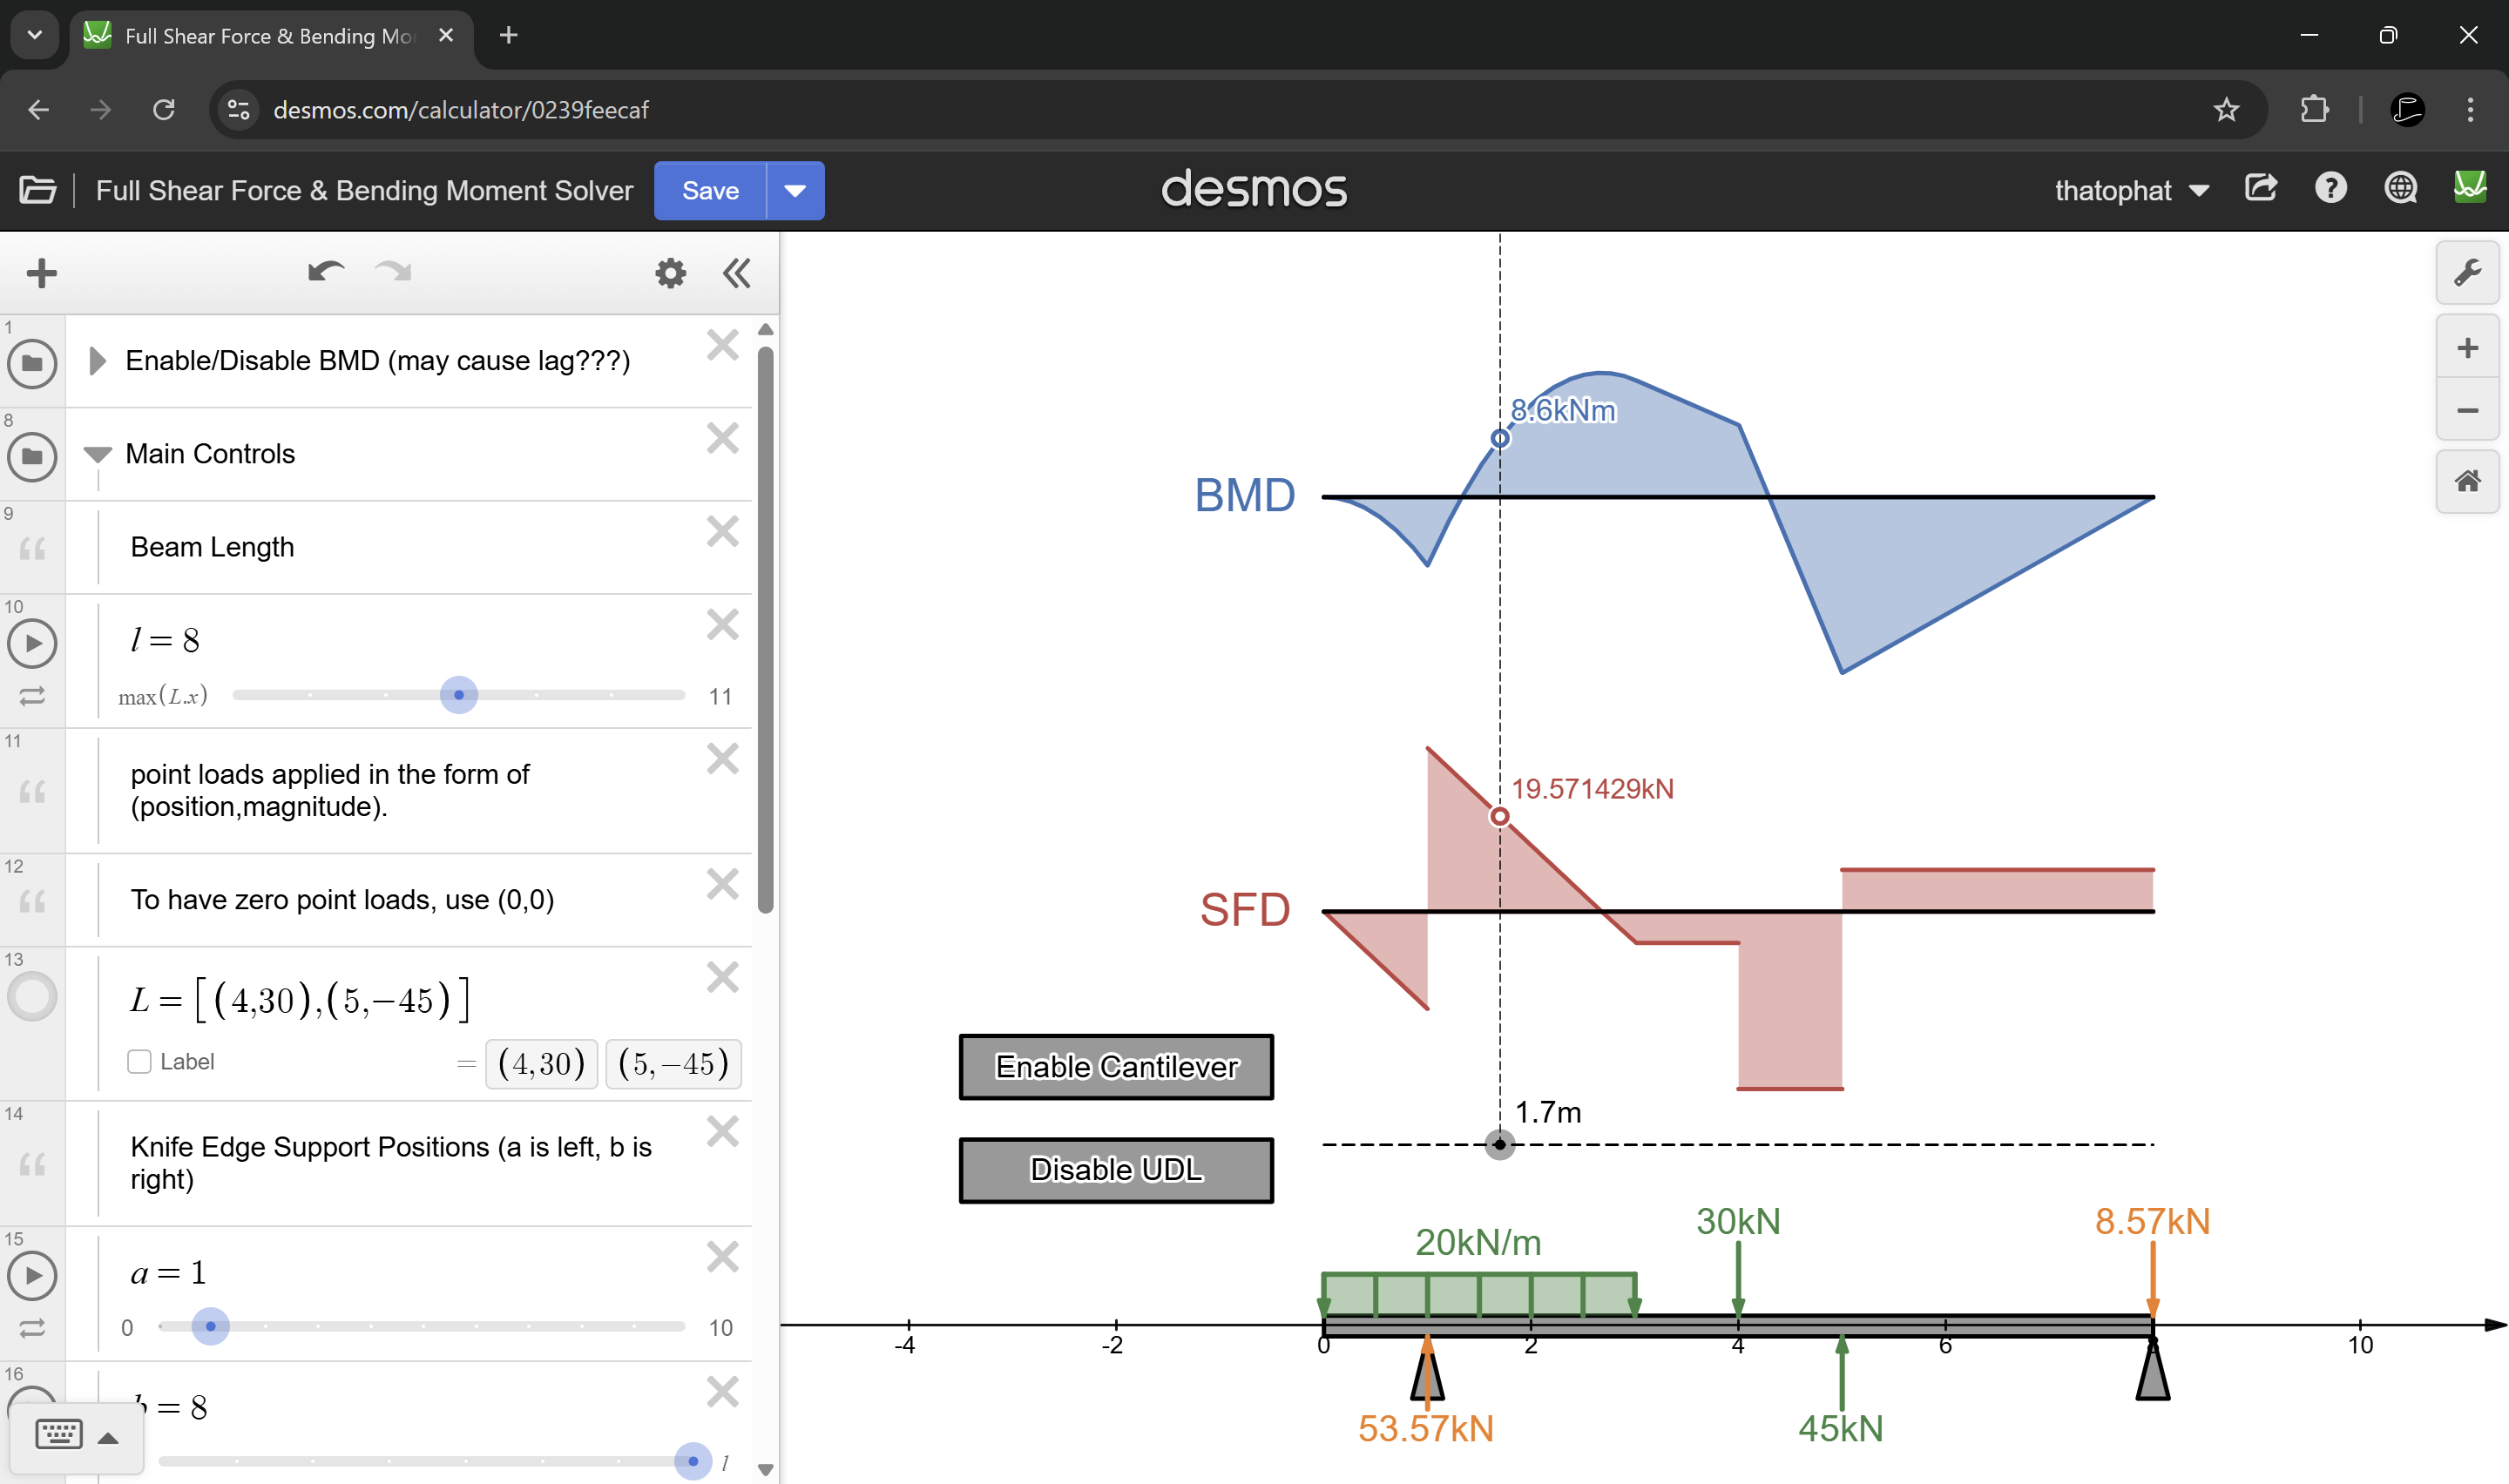
I made a solver that finds and draws the shear force and bending moment diagrams of a beam under
loading.
The solver takes in the loading condition of the beam through an array that represents the point
loads,
and maximum one UDL. It then calculates the reactions at each support, depending on the setup,
and creates another array
of the forces applied to the beam. It then takes the sum of forces of a subset of said array,
varying by a section that moves
across the beam, and plots the sum as the shear force. UDLs are settled as a seperate linear
section of the SF diagram, joined
as a piecewise function. The resulting SF diagram is then integrated, to get the BM diagram.
Both diagrams are scaled to fit in the view,
while remaining to scale.
The SFBM solver can be found in the notes page, or through this link
3D-Printed Screw Cap RE
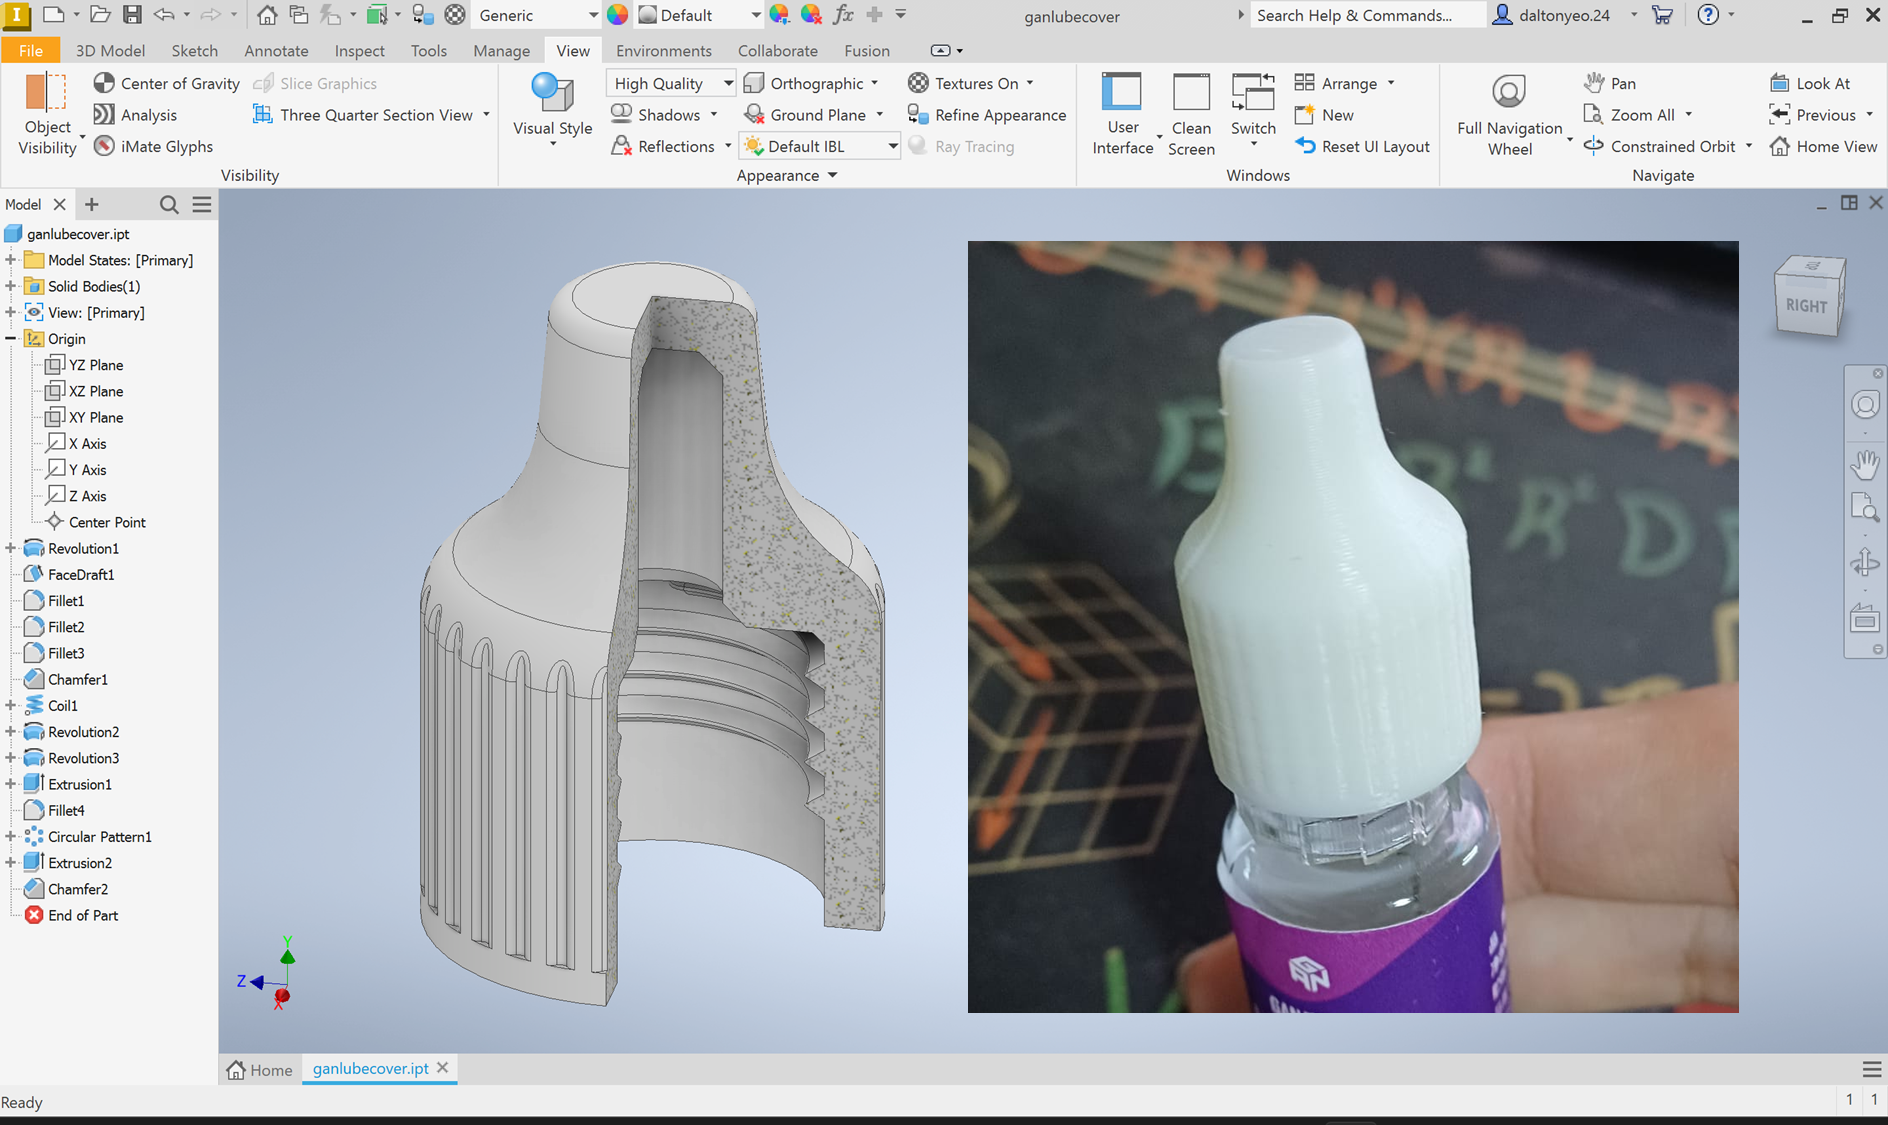
I reverse engineered and 3D-printed a lube cap for my cube lubricants to replace the original
fragile cap.
Due to the original design using a child-proof cap, the inner lining of the cap frequently
broke, causing it to be stuck on the threads, making it hard to
remove. Thus, my design is only one part, and is thicker to prevent fracture of the cap. I used
standard metrology methods with a vernier caliper to capture
critical dimensions, and modelled my design in Autodesk Inventor. Afterwards, I printed and
tested my design. This was my first time trying out 3D-printed threads,
and I found my attempt able to hold onto the lube bottle well, without much backlash or
looseness.
FluidSIM PLC Simulator
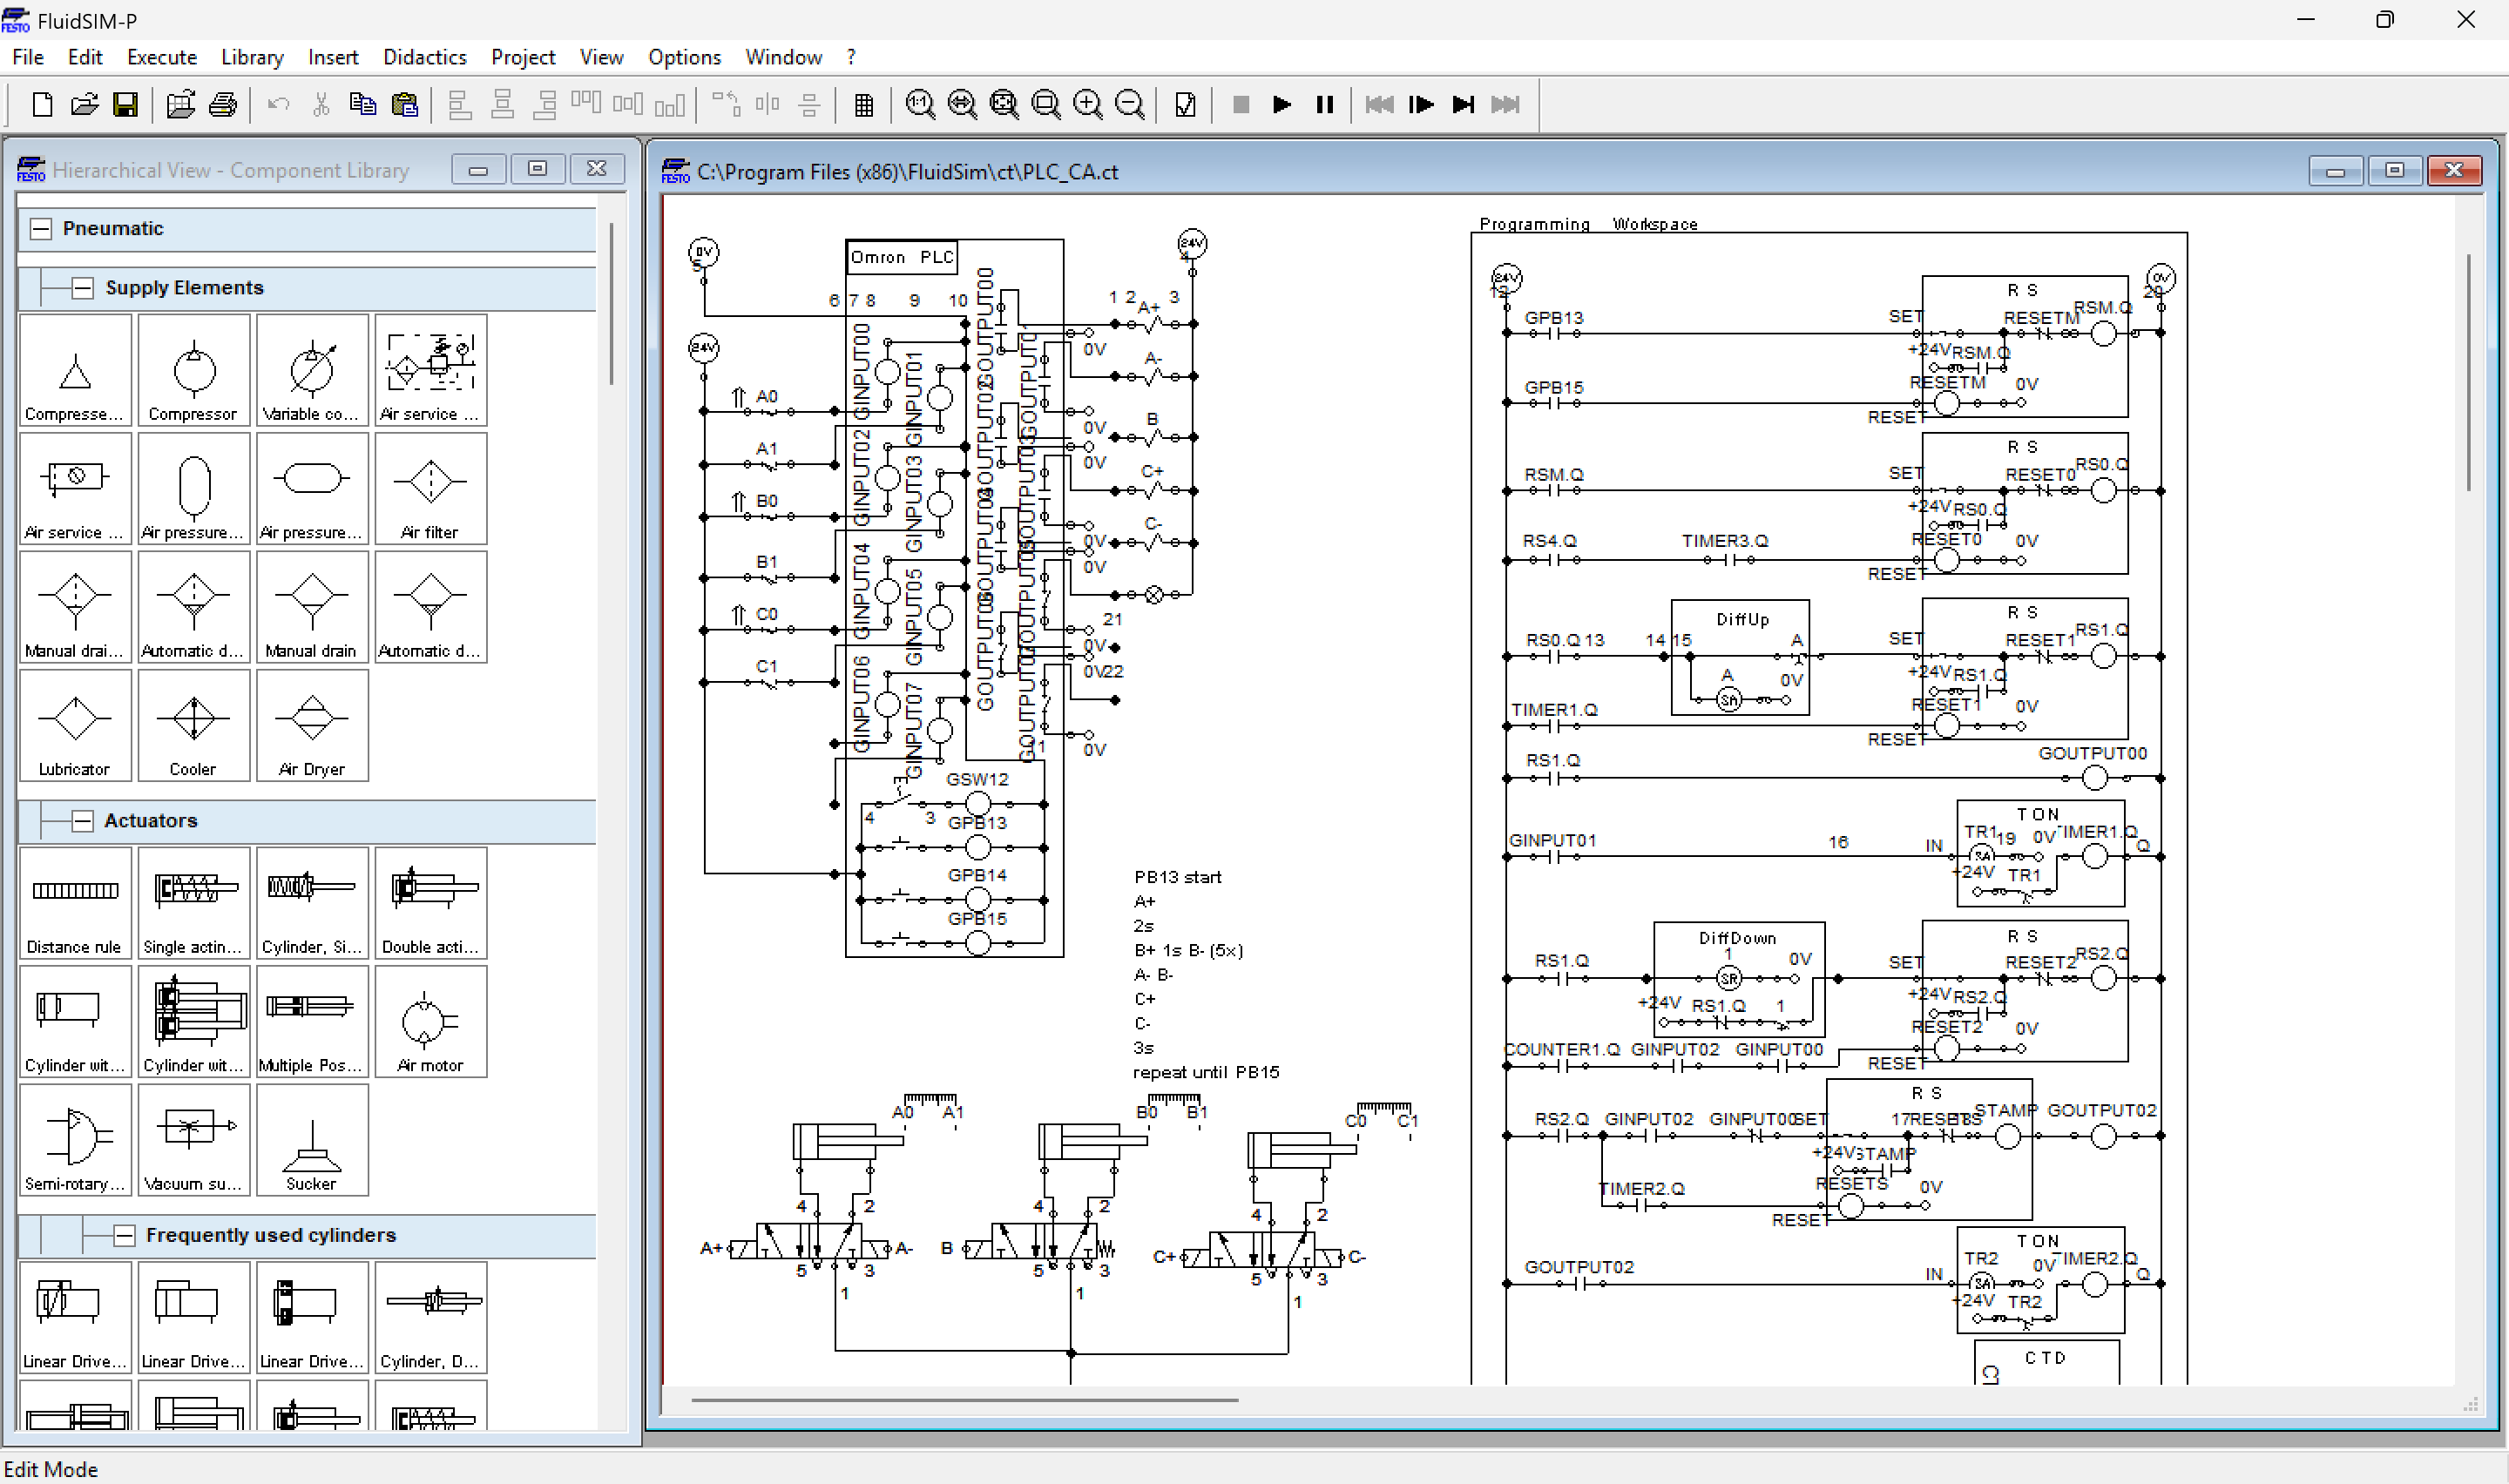
I made a Omron PLC simulator inside FluidSIM to simulate electro-pnuematic PLC circuits and PLC
programs.
As the PLC programming software we use is not available for us to download on our laptops, it
was difficult for us to test programs for our lab tests and exams to see
if they worked. Since we were given access to FluidSIM, I created a PLC simulator using
electromechanical components in the FluidSIM library.
It works by abstracting the logic of the function blocks like TON and CTD blocks with relay
logic, and communication from the PLC to the CPU(program) also works on relays
and coils. I managed to gain a better understanding of electro-pnuematic systems, as well as how
PLC logic works, and was able to accurately test my programs for lab tests.
Statistics & Analytics Project Extension
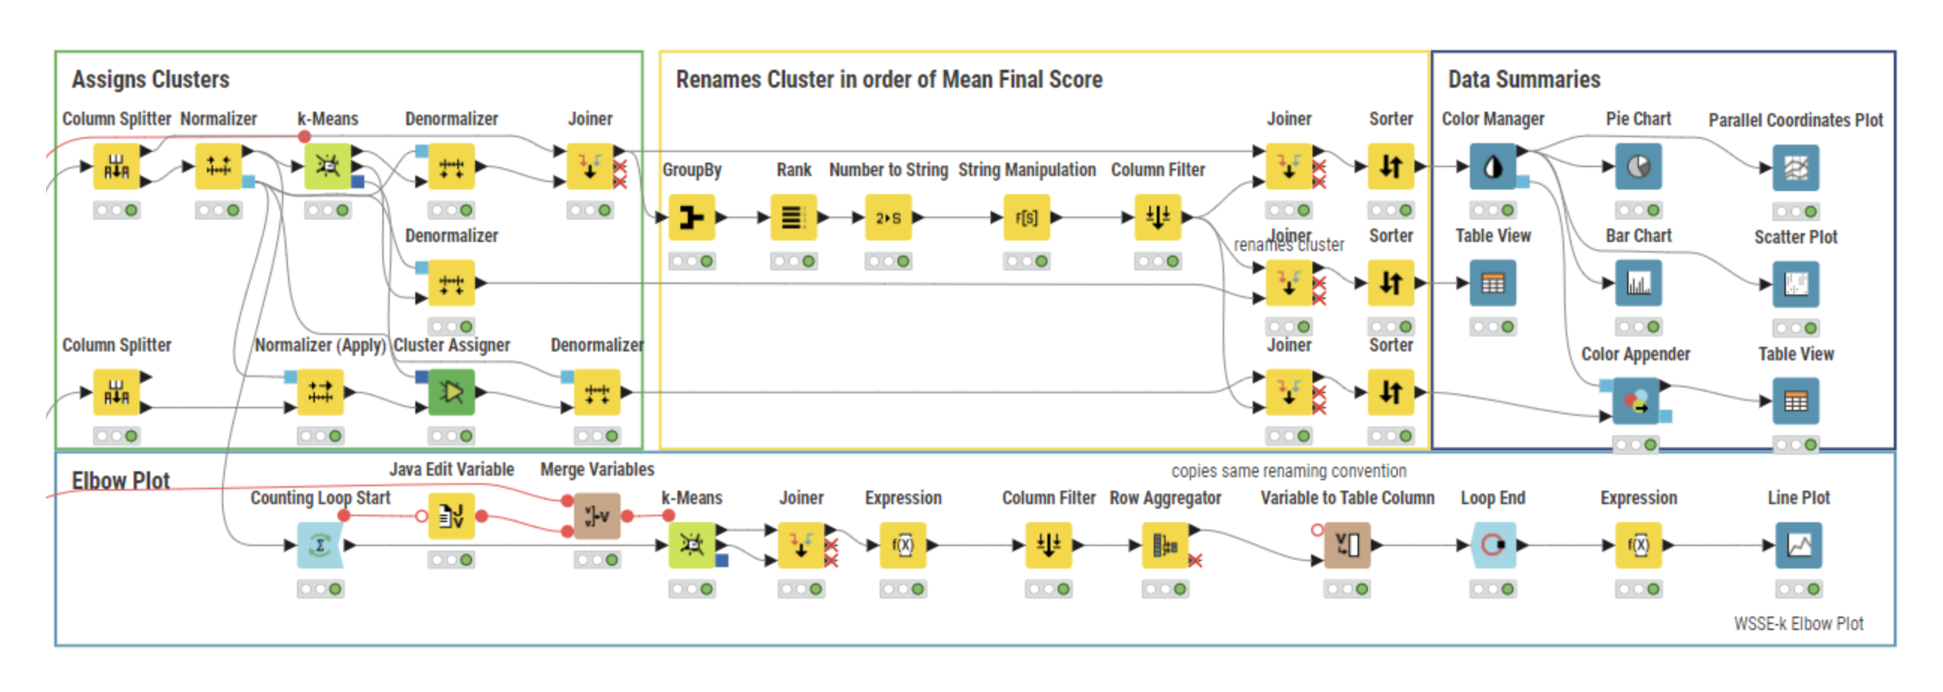
I extended my statistics and analytics project by creating WSSE-k Plot Generators and
Evolutionary Feature Selection Models to optimise data models.
For this project, it involved predicting a cohort of student's risk of needing academic
intervention programs based on their scores, and
wanted us to create models that could do so.
Instead of just typical k-means clustering and decision tree models, I wanted to see how these
models could be objectively optimised. The WSSE-k Plot generator works by iterating the k value
in the counting
loop, finding individual squared errors from the centroid and summing them together into a
table. The table is then
plotted to give the WSSE-k plot, which was used in the project to find the optimal k value for
different models.
I also experimented with a Evolutionary Feature Selection Model to choose the variables for
regression models. I tested forward
selection and backward elimination to iteratively pick variables that could predict the
student's final score and thus their risk. The
models were then sorted by their R^2 value to show which set of variables worked the best. In
the end, I found backward elimination was
more effective, but found desicion tree models to be more nuanced in analysing and classifying
the data.
TEDTalks
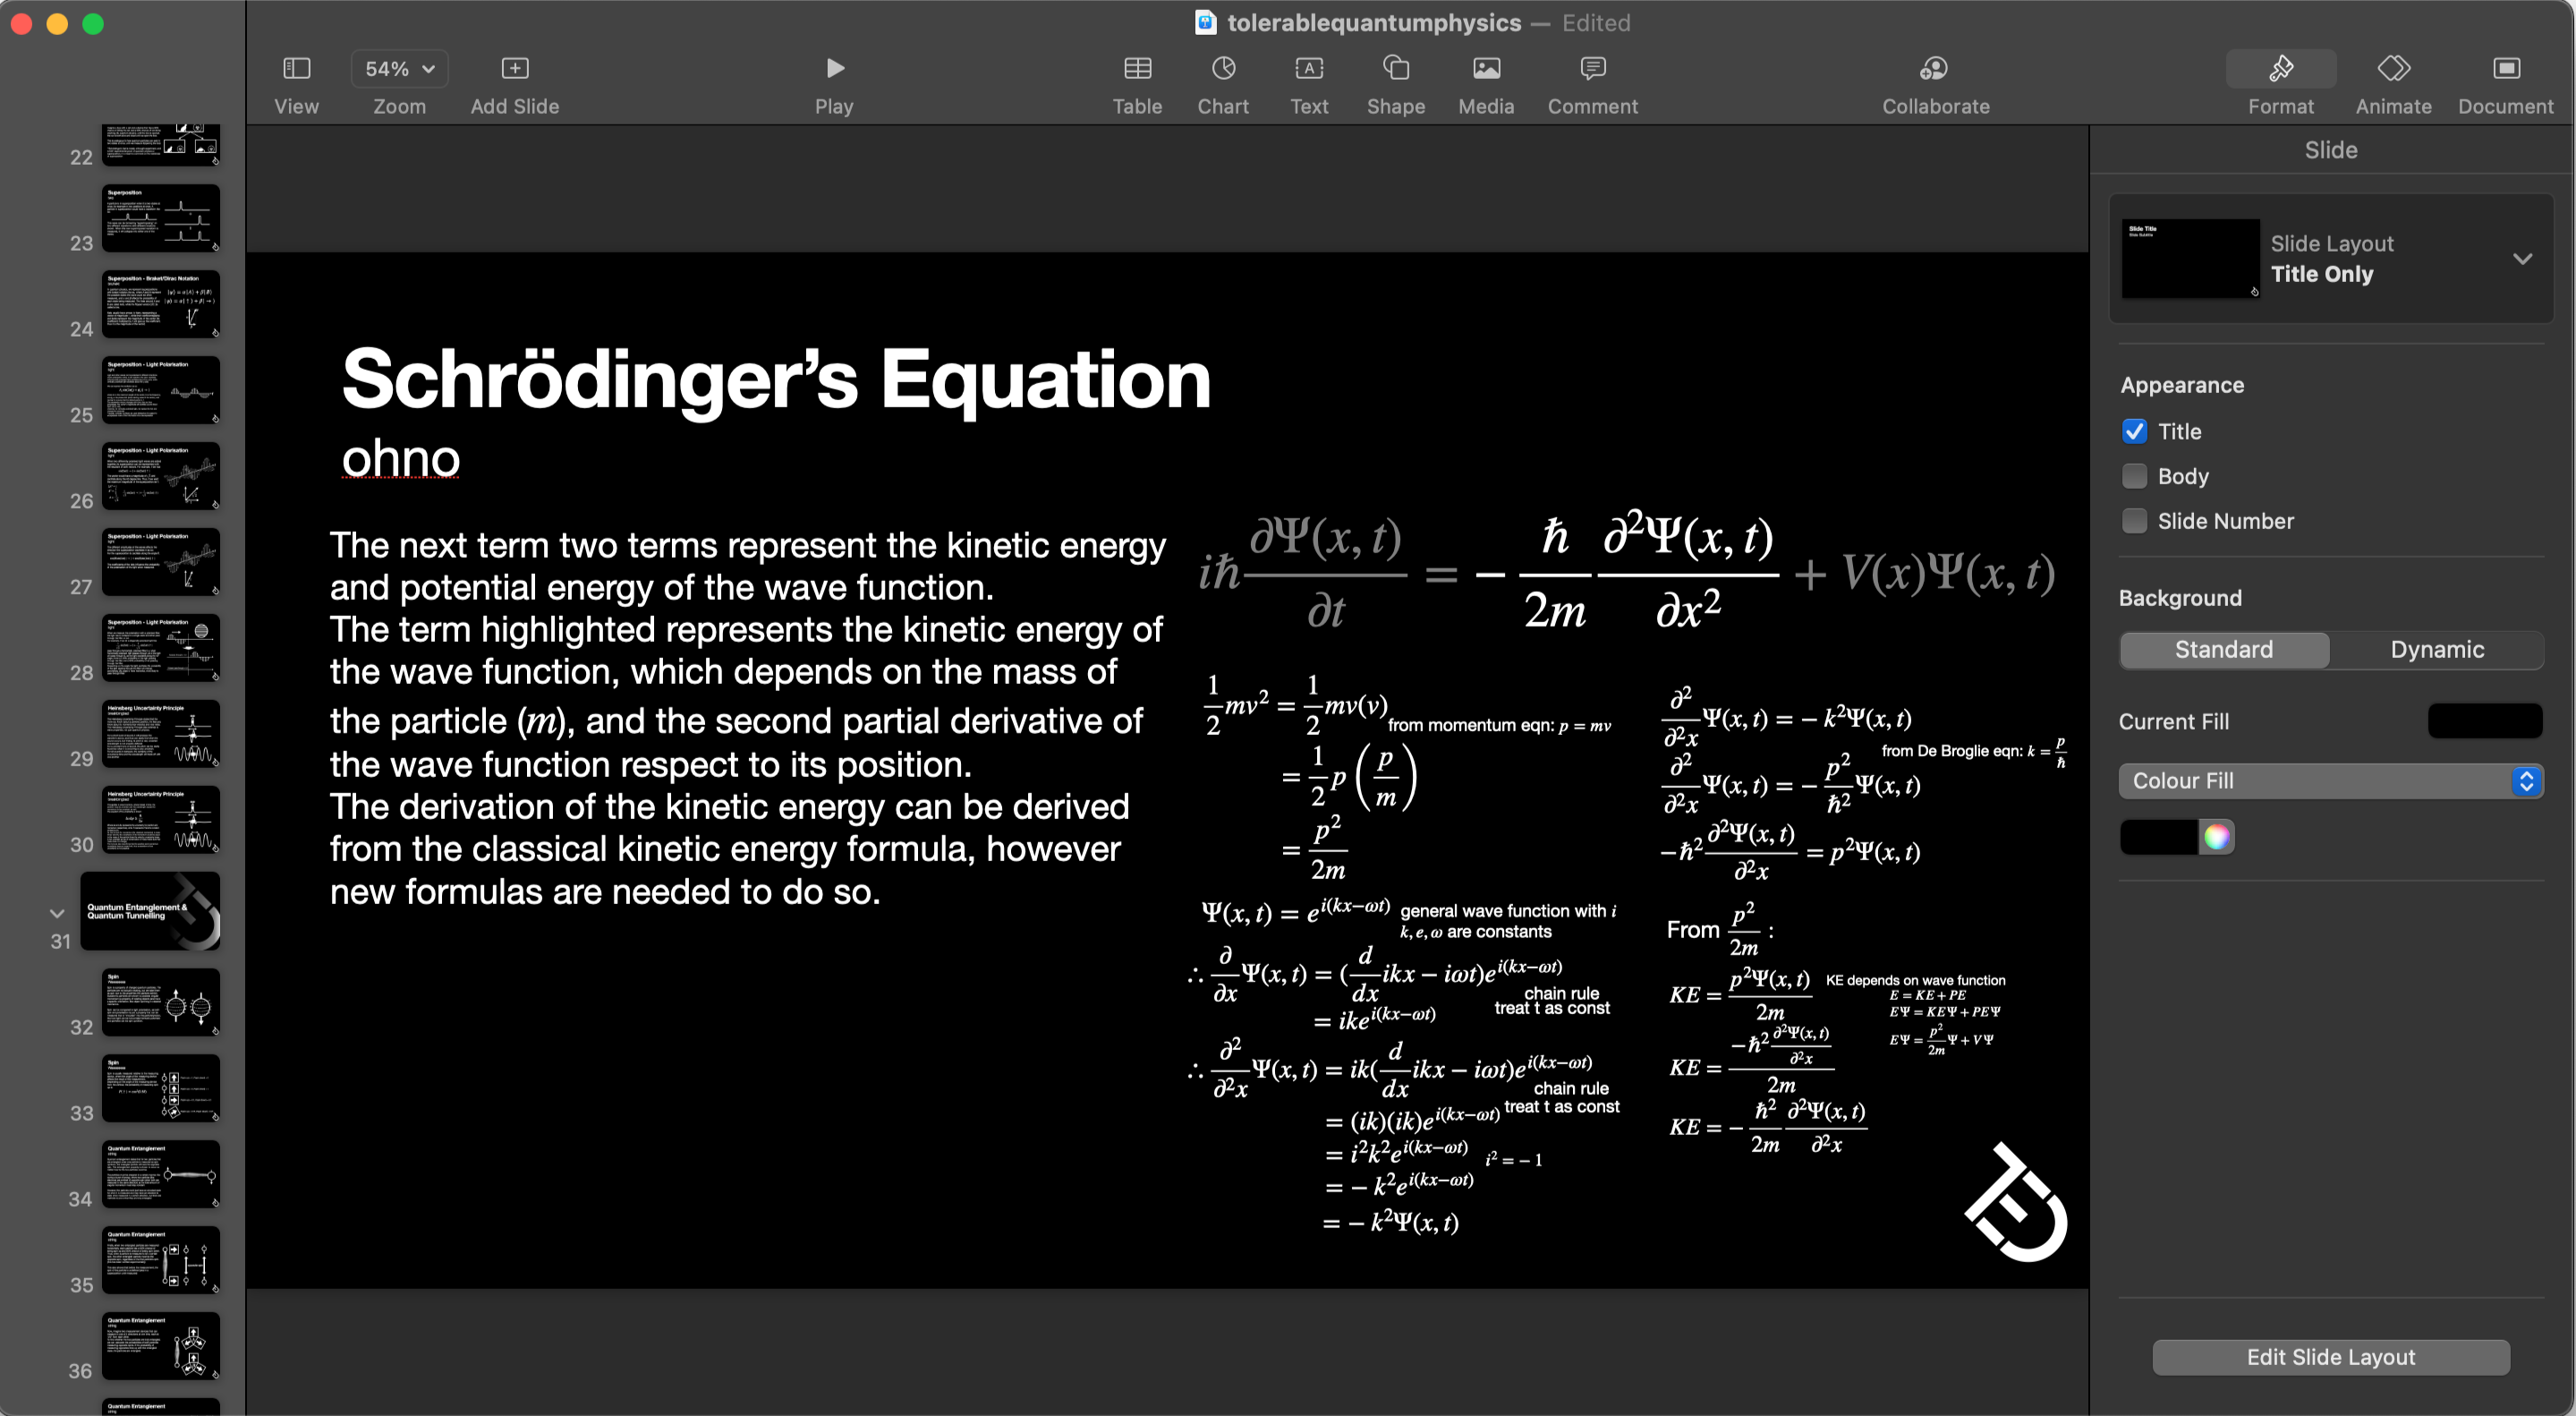
TEDTalks is a personal project where me and my friends in secondary school would create resources
and have online calls in a server teaching different subjects to our peers.
I created O level E Math, A Math and Chemistry slides that I would teach to my peers to help
them clarify
their doubts, allowing them to get a better understanding of the content taught in school. I
would also teach
about other STEM areas that interested me, like further calculus and basic quantum mechanics, to
share my interest
with others. In total, we managed to get ~300 people to join our server, and
had calls of up to
45+ people at once.
Canal Design Optimiser
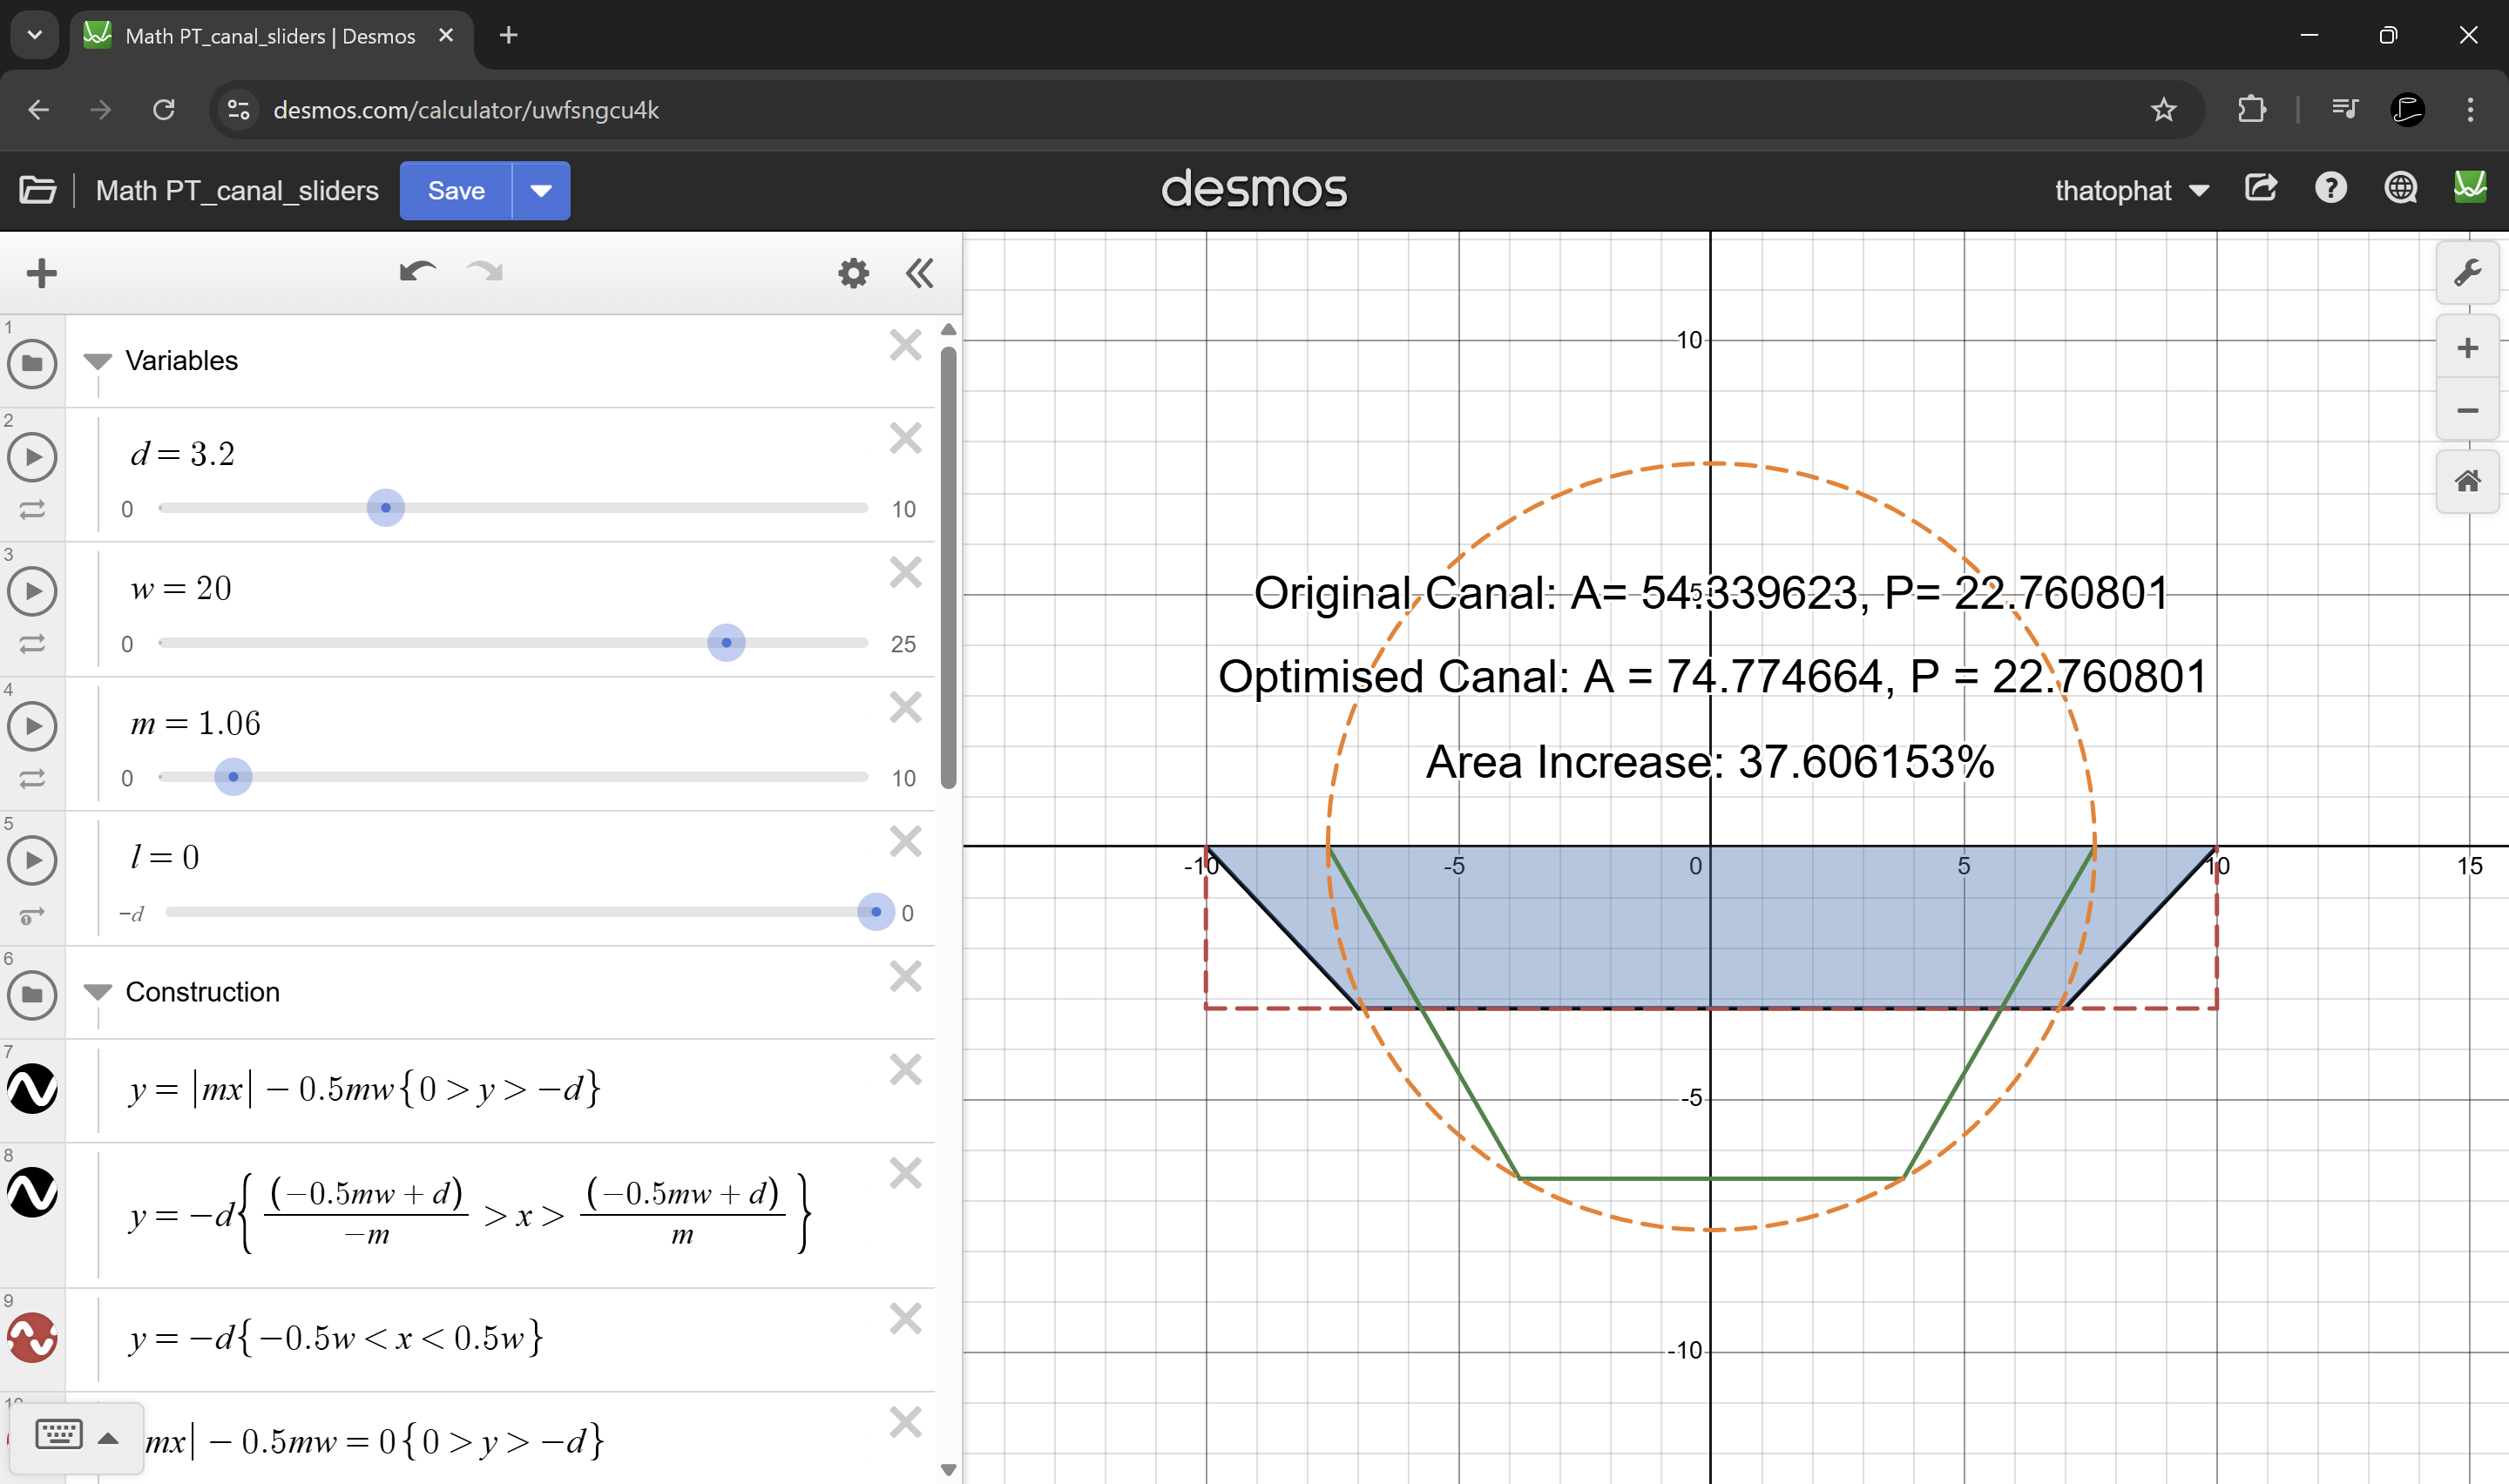
I made a Desmos solver that optimises the dimensions of a canal to hold the most water given the inital dimensions of a canal.
As part of my Secondary 3 project, I wanted to take the idea of using the same materials to optimise the canal's capacity to
be more formalised and general. The way it works is by drawing the initial canal with absolute functions, and drawing half a hexagon
of equivalent area. I also wrote an essay explaining my methodology, for how the initial canal is drawn, how the dimensions are obtained
from the actual canal, and how the canal was optimised.
The essay can be found here.